

Process Failure Mode Effects Analysis (PFMEA) is a methodology used to remove errors from a process. Errors are identified, prioritized, and then mitigated systematically.
For instance, corrective action in the early stages of a product life cycle is ~29x less expensive than corrections made later on in the design process. This shows that early error identification, using methods such as PFMEA, saves organizations heaps of time and money.
In this FAT FINGER article, we’ll explain what PFMEA is. We explain how the methodology came about and then why this error-mitigation approach should be implemented. You can then use our 10 step guide to implement the PFMEA model for process error mitigation.
- What is PFMEA: Process Failure Mode Effect Analysis explained
- How are processes evaluated using PFMEA?
- How to apply the PFMEA approach in 10 steps
- PFMEA example: Application of the PFMEA framework in manufacturing
What is PFMEA? Process Failure Mode Effect Analysis explained
Process Failure Mode Effect Analysis (PFMEA) is a Six Sigma methodology designed to identify risk and rate critical failure modes of a given process.
PFMEA is traditionally applied to operating processes within the manufacturing industry and was developed with the notion that such processes are rarely perfect. In the usual systematic fashion of Six Sigma Methodologies, PFMEA offers a step-wise means of process analysis.
The PFMEA methodology defines the impact of failure, and then identifies and prioritizes action items, with the end goal of alleviating process risk.
The birth of the PFMEA approach from Six Sigma
Six Sigma is a set of techniques introduced by American engineer Bill Smith in 1986. Smith introduced the Six Sigma methodology to improve operational processes in manufacturing businesses. Six Sigma strategies seek to improve manufacturing quality by identifying defect causes and minimizing variability in operations.
A given Six Sigma project has defined targets, such as reducing pollution or increasing customer satisfaction. The project will then follow a clear Six Sigma methodology to deliver on that target. In the case of PFMEA, that target is to reduce process errors and defects.
When should you use the PFMEA methodology?
PFMEA is best implemented during the development of a given production process. This gives organizations time to detect and treat process failure.
PFMEA can be used in many different scenarios, as detailed below:
- Before the development of control plans for a new or modified process,
- As quality control during the execution of a process,
- When a new process step is introduced to a given operation,
- When an existing operation is targeted for improvements,
- When different methods are introduced to an existing process,
- When there a significant changes to resources, equipment, or the operating environment,
- When inefficiencies, errors, and/or process breakdowns occur.
Who is responsible for the PFMEA?
It’s best practice to have a leader overseeing the PFMEA process. But then other teams should be included, such as:
- Design teams,
- Production teams,
- Quality assurance teams (product and supplier),
- Service and logistic teams.
It’s important to take a multidisciplinary approach when implementing the PFMEA methodology. Each team member should be experienced in their field so they understand how the analyzed process will impact their department. It’s also important that each team member thinks about process limitations from their perspective.
How are processes evaluated using PFMEA?

PFMEA evaluates each step of a process, to assign a score on a scale of 1-to-10 for the following variables:
- Severity: The impact of the process error is assessed. 1 represents errors of least concern, and 10 represents dangerous and hence high-priority errors. In most cases, severity scores exceeding 8 are prioritized.
- Occurrence: The likelihood of the failure occurring is determined. 1 represents the lowest likelihood of occurrence and 10 represents the highest. For instance, 1 may indicate a failure occurring once every 10 years, whereas a likelihood score of 10 indicates the failure occurs several times in a day.
- Detection: Not all process failures can be detected to be resolved. The same 1-10 scale is used to decipher how detectable a process error is. A score of 1 is used for process errors that have the highest chance of detection, and a score of 10 indicates errors with the lowest chance of detection.
- Risk priority number (RPN): The RPN score multiplies the severity, occurrence, and detection measures together to establish a final score value. If the RPN value exceeds 800, then that means corrective actions need to be prioritized.
How to apply the PFMEA approach in 10 steps
Below we’ve outlined 10 steps for implementing PFMEA. Follow these steps for effective implementation of this Six Sigma approach.
Step #1: Review the process
You’ll want to begin the PFMEA process by firstly documenting and mapping out the process in question.
You can do this easily using FAT FINGER (your ultimate no-code process documentation software). With FAT FINGER’s drag-and-drop process builder, anyone – regardless of their experience – can document a given business operation.
Documenting processes in this way lays out every operational step for ultimate transparency. This transparency is needed to execute the rest of the PFMEA process. You can use FAT FINGER’s features such as our Smart Logic, Active Alerts, and Integration features to document the process complexity you need.
Once the steps of the process in question have been captured, the next stage is to think about the function of these steps and their requirements, as we discuss:
- Function: This is the reason, purpose, or intended outcome of a step in the process.
- Requirement: This is the what and the inputs needed for a step in the process to be completed with success.
Step #2: Identify potential process errors
Step 2 of PFMEA identifies potential process errors, otherwise known as failure modes. You will need to identify how each step of the process could fail in fulfilling its function.
Use the following system to categorize the failure type identified:
- Full failure: It’s not possible to complete the given process step. This could be due to a system, or component error.
- Partial failure: There’s still some functionality, meaning this step is coming to partial completion, yet the system is not operating as it should.
- Intermittent failure: Sometimes the step is completed, sometimes it’s not. A malfunction occurs on an irregular basis.
- Degraded failure: Frequent usage leads to system fatigue which causes the unsuccessful completion of the process steps, causing the end result to deviate from expectations.
- Unintentional failure: The failure of one step causes the failure of another.
Step #3: List the potential effects of each failure mode
Failure in any step of a given process can leave a long tail of impacts, having knock-on effects several steps downstream, and even on other related processes. This can impact customers, suppliers, and timelines.
It’s important to document these overlapping effects for any identified failure. Be sure to show dependencies between different processes, process inputs, and outputs.
Step #4: Assign a severity rating
Using the severity rating scale previously discussed, consult with your team to determine how critical the process failure identified may be. Remember, your rating process failure severity on a scale that runs from 1-to-10. You can use the following categorization for reference:
- 9-10: Very severe consequences of the failure are expected, where safety factors cannot be overlooked.
- 7-8: There’s a loss or reduction in the primary function of a given step in the process.
- 5-6: There’s a loss or reduction in the secondary function of a given step in the process.
- 2-4: The process errors are more of an annoyance rather than impacting process function.
This classification method is used to prioritize failure modes. When determining the severity of process failures, be sure to account for the materials, inputs, and regulations used.
Step #5: Define the cause of the failure
This is when you need to be asking the question “how did this happen?”
For each identified failure, provide a description that defines the failure’s root cause. You may rely on your team and work with them to list all the potential root causes. Listing these root causes means you’ll be able to resolve the issues later in the PFMEA framework.
Step #6: Assess current design controls
Design controls describe the failure you plan to avoid. These take the form of prevention and detection during the PFMEA process.
- A prevention control: This is when the causes of a potential failure are removed to prevent the failure from happening in the first place.
- Detection control: Measures are built into the process to detect failures as they occur meaning they can be resolved quickly.
The idea around these design controls is to avoid the effects of failure. You can do this by either detecting the failure quickly to then resolve it or by preventing the failure in the first place.
You’ll want to work with your team to discuss possible what-if scenarios to assign the appropriate approaches to mitigate each potential failure.
Step #7: Assign occurrence rating
As previously mentioned, a failure is not only ranked according to its severity but also by how likely it will occur.
You and your team don’t want to waste time dealing with errors that aren’t likely to occur. You, therefore, want to assign occurrence ratings which you can use alongside your severity measures, to give some direction to the last few steps of the PFMEA model.
Assigning the likelihood of a failure occurring may initially seem subjective. To make this step easier, consider the following rates for measurement:
- The failure is fully prevented by the process design,
- There’s a 1 in 1,000,000 chance of the failure occurring,
- There’s a 1 in 100,000 chance of the failure occurring,
- There’s a 1 in 10,000 chance of the failure occurring,
- There’s a 1 in 2,000 chance of the failure occurring,
- There’s a 1 in 500 chance of the failure occurring,
- There’s a 1 in 100 chance of the failure occurring,
- There’s a 1 in 50 chance of the failure occurring,
- There’s a 1 in 20 chance of the failure occurring,
- There’s a 1 in 10 chance of the failure occurring.
Step #8: Assign the detection rate
Next, it’s time to assign a detection ranking to the failure in question. When assigning the detection ranking, use the following scale:
- The current controls are almost certain to detect the failure.
- There’s a very high likelihood that the current controls will detect the failure.
- There’s a high likelihood that the current controls will detect the failure.
- There’s a moderately high likelihood that the current controls will detect the failure.
- There’s a moderate likelihood that the current controls will detect the failure.
- There’s a low likelihood that the current controls will detect the failure.
- There’s a very low likelihood that the current controls will detect the failure.
- There’s a remote likelihood that the current controls will detect the failure.
- There’s a very remote likelihood that the current controls will detect the failure.
- There’s no known control available to detect the failure.
Step #9: Calculate the RPN and determine the required corrective action
Multiply your severity rating, occurrence rating, and detection rating together to determine the RPN. The RPN value will be between 1 and 1000. Remember the higher this value is, the greater the risk involved.
You can use the RPN value for a given failure to identify what corrective action is needed. High values indicate higher severity, higher likelihood of occurrence, and/or low levels of detection.
Step #10: Assign, plan, execute and recalculate
Assign team members to rally and manage the corrective actions as required, according to their skills and experience. Agree with your team members on the accountability and the timeline for the changes to be implemented.
Once the corrective action has been put into practice, it’s time to reevaluate your RPN by returning to step #1 of this process.
Your aim is to keep in touch with your organization’s tolerance for risk and work towards continuous improvement. Your goal is to have optimal processes with tolerable or no risk.
PFMEA example: Application of the PFMEA framework in manufacturing
Below is an example of the PFMEA framework in action. Let’s work through this example together.
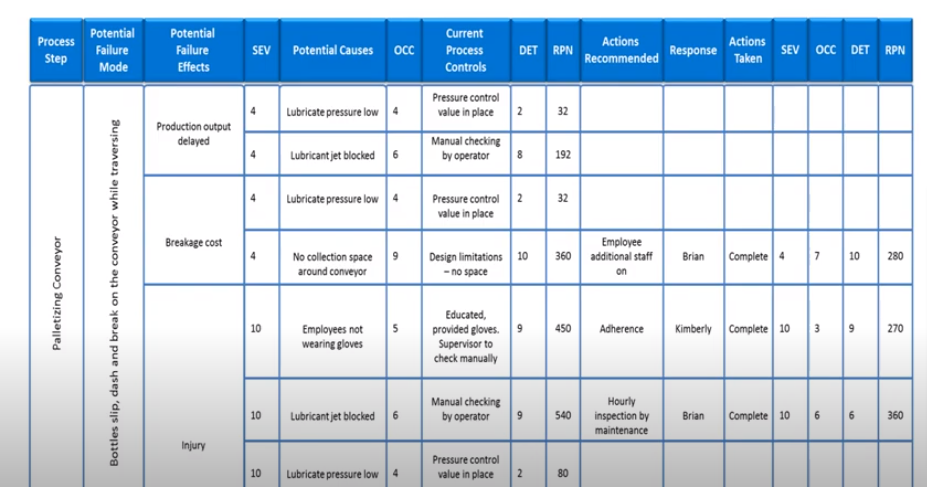
Consider the following scenario. We have a conveyor belt that packages juice bottles. However, the bottles seem to be slipping down this conveyor belt and bashing against each other causing them to break.
This is an example of a process failure that’s causing a loss in production, materials, and ultimately revenue.
The issue also has knock-on effects to other processes running in parallel, for instance, when the bottles break they spill their contents over the conveyor belt, damaging it. Once more, this one identified error can lead to other potential failure effects. Three of which have been listed below:
- Output production is delayed,
- There are higher production costs from material breakage,
- Employees can get injured from broken glass.
For each identified failure effect, potential causes are defined to understand these failures more clearly. For instance:
- Production of output is delayed: One potential cause is the lubricant pressure for the conveyor belt is low.
- Higher production costs from material breakage: One potential cause is the lubricant pressure for the conveyor belt is low.
- Injury from broken glass: One potential cause is the employees aren’t wearing gloves.
Using the PFMEA methodology, we’ve assigned severity, occurrence, and detection values to each of the identified potential error effects, as follows:
- Production of output is delayed, with the potential cause of low lubrication pressure: Severity = 4, Occurrence = 4, and detection = 2.
- Higher production costs from material breakage with the potential cause of low lubrication pressure: Severity = 4, occurrence = 4, and detection = 2.
- Injury from broken glass with the potential cause of an employee not wearing gloves: Severity = 10, occurrence = 5, and detection = 9.
As you can tell, each error failure effect has different severity, occurrence, and detection values assigned.
Using the values for severity, occurrence, and detection, the RPN value is calculated, as follows:
- Production of output is delayed, with the potential cause of low lubrication pressure: 4 x 4 x 2 = RPN of 32
- Higher production costs from material breakage with the potential cause of low lubrication pressure: 4 x 4 x 2 = RPN of 32
- Injury from broken glass with the potential cause of an employee not wearing gloves: 10 x 5 x 9 = 420
The RPN values are then used to define urgency for resolving a given error. In this instance, employee injury from broken glass is identified to be the most urgent failure to resolve.
A resolution strategy is applied whereby employees are asked to adhere to the safety regulations of wearing gloves by rule. A team member is then assigned to ensure this corrective action is put in place at all times.
Use FAT FINGER for process documentation to ensure consistency during PFMEA
Consistency is important for implementing the PFMEA process. And there’s no better way to ensure consistency than by documenting your business operations.
Process documentation assures operations are followed to the T every time they’re run. By following the process, the required steps are executed in the right order, by the right person, and at the right time.
Process documentation is vital during step #1 of the PFMEA process. But also, why not use FAT FINGER to document the 10-step PFMEA model given in this article?
For more information on FAT FINGER, how to get started, and how to document your business processes using this software, watch the below video:
Sign up for your free FAT FINGER trial here and start effectively managing your business operations.