

The cloud-based human resource management software company Zenefits lost 50% of its share price over 2016 due to poorly managed business workflows.
Workflows mapped by Zenefits failed to account for the appropriate registration and licensing of many of its vendors. The company was fined $7 million by California’s insurance regulator.
This tale of Zenefits exemplifies what can happen with poor business workflow implementation.
Workflows run at the heart of an organization, meaning to be successful an organization must have a solid understanding of these workflows. And in this FAT FINGER article, we’ll explain how you can do just that using a workflow diagram.
Learn how to document business workflows using a workflow diagram in 5 simple steps, and avoid operational blunders such as those experienced by Zenefits. Gain a better understanding of your business operations, improve transparency, cut costs, and identify inefficiencies.
In this article, I’ll discuss:
- What is a workflow diagram?
- Workflow diagram example
- What are the benefits of using a workflow diagram?
- 5 simple steps for creating a workflow diagram
Let’s begin.
What is a workflow diagram?

“An orchestrated and repeatable pattern of business activity enabled by the systematic organization of resources into processes that transform materials, provide services, or process information.”
– EESPA, Workflow
A workflow diagram is a step-by-step linear representation of a business process. Tasks are presented in sequential order, showing the resource flow between team members from start to finish via a system of shapes and symbols.
The creation of the workflow diagram all began by defining a business process. A business process is an interconnected flow of tasks that lead to the delivery of a service or product for the end-user. Business processes help organizations accomplish their goals.
Scottish economist Adam Smith was the first to document a business process using operations from a theoretical pin factory. By dividing labor, and creating a system where production was done by a process, output soared by 24,000%. This was due to the identification of inefficiencies and bottlenecks.
”One man draws out the wire, another straights it, a third cuts it, a fourth points it, a fifth grinds it at the top for receiving the head: to make the head requires two or three distinct operations: to put it on is a particular business, to whiten the pins is another … and the important business of making a pin is, in this manner, divided into about eighteen distinct operations, which in some manufacturers are all performed by distinct hands, though in others the same man will sometime perform two or three of them.”
– Goodreads, Adam Smith
Building on the concept of a business process gives us the term workflow. The two are often used interchangeably, yet a business process is not a workflow.
- Business process: A business process defines the steps required to complete a task. A process has a specific input and gives some output after performing a series of tasks and activities. That output delivers value to the customer and the business.
- Business workflow: A business workflow is a more general term. A workflow may not have one specific input and shows the flow of data, documents, activities, and tasks through an organization. It’s big picture thinking, more like a zoomed-out view of an organization’s business processes. At each stage in the workflow, there may be a specific business process. Workflows allow for a better understanding of business processes, to automate and improve efficiency.
The founding fathers of the term workflow were Frederick Winslow Taylor and Henry Gantt. They are credited as the first to study the rational organization of labor, and with a particular focus on the manufacturing industry. We’re going back some 100 years here (around 1887) when these two engineers applied scientific and mathematical principles of engineering to managing and manufacturing business. The aim was to produce a highly effective production system.
Business workflows have become more sophisticated over the years. 1980 was the burgeoning time for business workflows, and with that, the workflow diagram, as a quality management effort, was created.
Common terms related to the workflow diagram
A workflow is often confused with the terms flowcharts and business process mapping. This is a common misconception – the terms are related but they are not the same.
- Flowchart: A flowchart is an actual chart used to illustrate your workflow. Flowcharts can be used to depict a variety of concepts, a workflow is simply one such concept.
- Business process mapping: Documenting a workflow and creating a workflow diagram is just one part of business process mapping. Business process mapping is a holistic approach to coordinate and map the different activities, data, systems, and people involved in a business operation for optimization.
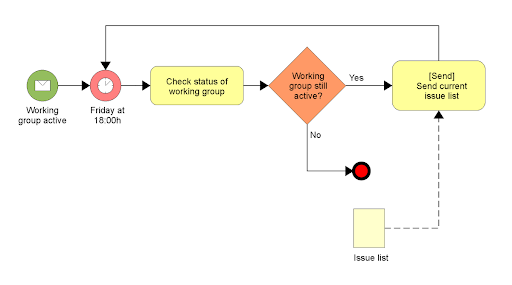
Workflow diagram example
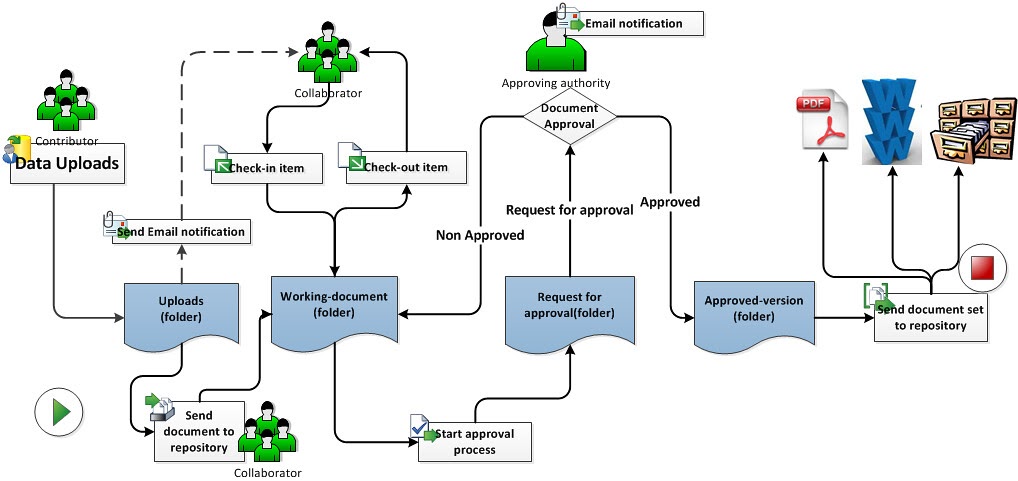
The above is a simple example of a workflow diagram for a document management system.
The diagram shows that the workflow begins with contributors uploading or creating a new document for collaboration. The document is then sent to the request for approval team, where authority is notified.
If the document is disapproved, it goes back to the working document. If approved, the documented moves to the approved version folder.
As you can tell, the workflow diagram shows the flow of the resource – the documents – between team members.
What are the benefits of using a workflow diagram?

A workflow diagram provides an easy to understand visual representation of a business process, giving a big picture view of the relationships between actions, tasks, and work functions.
To explicitly state the benefits of a workflow diagram, I’ve listed common advantages below:
- Improved communication: Workflow diagrams provide a visual platform for teams to communicate and collaborate on business operations. A common and sound representation of what is required of leaders and team members is presented. Leaders can use the workflow diagram as a tool to remove weak communication links within teams, analyze results, resolve conflicts and monitor ongoing progress.
- Provide transparency: Within a workflow, the duties of team members are clearly specified. Employees know what they need to do and what to expect. This helps engage employees, give them autonomy, and build trust.
- Identify inefficiencies: A workflow shows a standardized and optimal way of completing business operations. This means they are always performed in the same, most optimal way, reducing confusion and inefficiencies.
- Reduce costs: As the workflow processes are standardized and work gets done faster, organizations discover that they require fewer resources, meaning they can do more with less saving both money and increasing profitability.
The benefits workflow diagram gives means they are popular tools for a range of different industries.
The benefits of workflows example: Improving patient turnover in the operating theater
A study by Cendan and Good looked at activities within operating rooms at a hospital.
The team spent time understanding the different tasks both the doctors and nurses performed, and designed workflows and workflow diagrams to visually represent different roles and how they interlinked.
This meant standardizing different functions and processes used in the operating theater. The newly designed workflow was communicated clearly to the staff involved. Cendan and Good then measured staff performance.
What did they find?
That by documenting the workflow, patient turnover increased, with more individual cases handled per day. In this example, having a better understanding of the different processes each individual has to undertake, and how they relate to the tasks of others, literally saved lives.
5 simple steps to create a workflow diagram

Below I’ve summarized how to create a workflow diagram in 5 easy steps.
Step #1: Document your business process
First off, you need to detail the following:
- The process or processes you intend to track and why.
- What you hope to discover by documenting this process or processes.
- The type of diagram you’ll be using.
- Whether your process is depicting your business processes how they stand, or a future scenario you want to attain.
After detailing the above, your next step is to document the business processes you wish to base your workflow diagrams on.
Documenting them may initially seem like a daunting task, but with FAT FINGER, you can detail operations as a workflow known as an “app” in seconds.
Use FAT FINGER’s straightforward software to easily document and execute your business processes. Once your processes are documented as apps, it’s simple to transcribe these processes into workflow diagrams.
Step #2: Select the workflow diagram type you want to use
There are a few different types of workflow diagrams, and below is a run-through of the most popular styles.
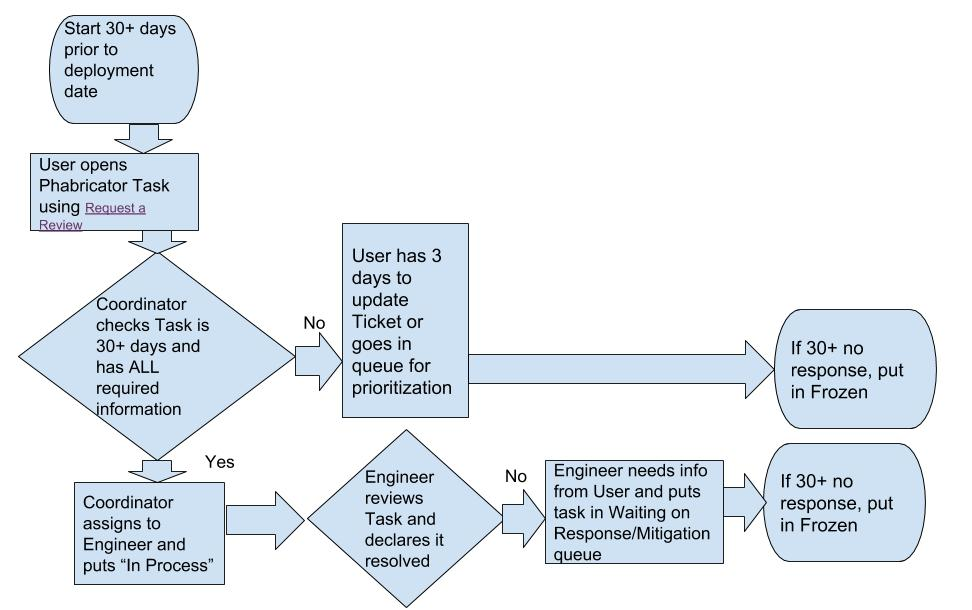
A process flow diagram:
A process flow diagram is the most basic type of workflow diagram. You simply map the workflow tasks out chronologically.
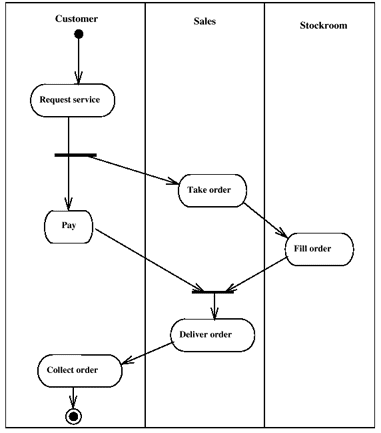
Swimlane diagram:
The swimlane diagram is a workflow diagram that separates two or more flows within an organization while retaining their sense of interconnectedness. This offers a broad overview of the different processes and highlights their interaction.
Business Process Modelling Notation (BPMN):
This type of business process diagram uses standardized symbols to make it easy for everyone to understand it. These standardized symbols include:
- Oval: This signifies the beginning and endpoints of a process. You’ll find these at the edges of the workflow diagram.
- Rectangle: This is where you’ll document instructions or actions.
- Diamond: These signify decisions. They contain a question, which leads to a yes or no answer. Responding to these questions allows progression.
- Arrows: These connect the shapes. The user should follow the arrows to the next step.
- Circle: Circles are used as connectors. They are used when the reader has to make a leap from one section to another, bypassing other stages. Circles are connected using arrows.
Step #3: Gather your information
This is where you need to speak to different people and departments to gather information and check workflow accuracy. Note down the activities involved in each workflow step, and label who is in charge.
Make a note of process timelines, highlight potential bottlenecks and areas for improvement/inefficiencies.
When identifying inefficiencies, look at the tasks in your workflow and categorize them into must have, useful, nice to have, and not necessary. When categorizing your tasks as such, refer back to the company’s overall goal. Ask yourself whether a specific task is contributing to this goal, and if not, then put that task into the not necessary pile.
Step #4: Design your workflow diagram
Define the start and endpoint of the business processes to be mapped. This should be the first thing you add to your workflow diagram.
Next, assign each stage of your workflow diagram with one of the following statuses:
- Input: This refers to something that impacts the following step. This could be an action, equipment, a decision, some information, or capital.
- Transformation: This refers to the changes that inputs go through to reach the output. This could be changed physical characteristics, a change in the location, or a change in ownership or purpose.
- Output: This is the finished product, what happens after the transformation.
You can use a pen and paper, or a diagramming tool to create your workflow diagram. It’s important to make your diagram shareable, editable, and simple to use.
Step #5: Analyze your results
When analyzing your results, ask yourself the following questions:
- Are there any workflow bottlenecks?
- Are any processes taking too long?
- Can efficiency be improved through automation?
Apply a process improvement tool to address process inefficiencies and bottlenecks. For instance, you can run a root cause analysis to address the underlying issues behind your biggest process pain points. Use this FAT FINGER root cause analysis app as a step-by-step guide for how you can do this.
FAT FINGER has a range of pre-built apps that will help you improve your business processes. To access these apps, just sign up for free here. You can also build your own workflow apps for whatever you desire from scratch!
Use these five simple steps, along with tools like FAT FINGER, to make the creation of workflow diagrams for your business easy. Improve business efficiency, avoid costly process errors, increase transparency, and continuously improve your business operations – what’s there to lose?
Learn about all the ways FAT FINGER can help you by watching this video.