

Imagine you’re at your local pool.
With your trusty swimming cap and goggles on, you take a deep breath, dive in, and begin your first lap with a breaststroke.
Within seconds — and seemingly out of nowhere — Michael Phelps, arguably the best competitive swimmer in the world, jumps in and starts swimming in your designated lane. Pro swimmer Ryan Lochte shortly follows. To add extra chaos and confusion, Katie Ledecky, another pro, does the same.
It’s bedlam: water is splashing everywhere, flailing limbs are bumping into other flailing limbs, and there’s the potential for what should be a fairly easy process to go horribly wrong.
It’s an out-and-out disastrous scenario.
In a business context, this is exactly what happens when people in an organization don’t know who’s doing what, when, why, and, most importantly, how. Because, when others are in your lane when they shouldn’t be, a simple job becomes 10x harder.
Luckily, the swimlane diagram can help.
In this FAT FINGER post, I’ll define what a swimlane diagram actually is, its history, explain how you can create a swimlane diagram, and go over its pros and cons.
Just read through the following sections to become a swimlane expert:
- What is a swimlane diagram?
- A quick history lesson on how the swimlane diagram originated
- How to create a swimlane diagram (& best practices)
- The pros of the swimlane diagram
- The cons of swimlane diagrams versus BPM alternatives
- Use FAT FINGER to complete multi-departmental processes without chaos & confusion
Now, let’s dive into the rest of the post — the water’s fine!
What is a swimlane diagram?

In layman’s terms, a swimlane diagram is a flowchart that states who does what and when in a specific business process and/or workflow.
To expand, a swimlane diagram is usually composed of several lanes — like swimming pool lanes — and each lane is dedicated to a department (e.g. marketing or sales) or a team. Within these lanes are shapes and text that visually show what task should be performed by which department so a process can be started and completed.
The shapes in a swimlane diagram specify certain things — i.e. start/endpoint, a decision, or an activity. However, there are no hard-and-fast rules for what shape you can use to specify something. What I mean by this is you can use a circle to signify the start/endpoint, or you could use a rectangle. As long as you remain consistent in how you use shapes in your diagrams, there won’t be a problem.
Here’s an example swimlane diagram that depicts the process for approving a customer’s purchase order:
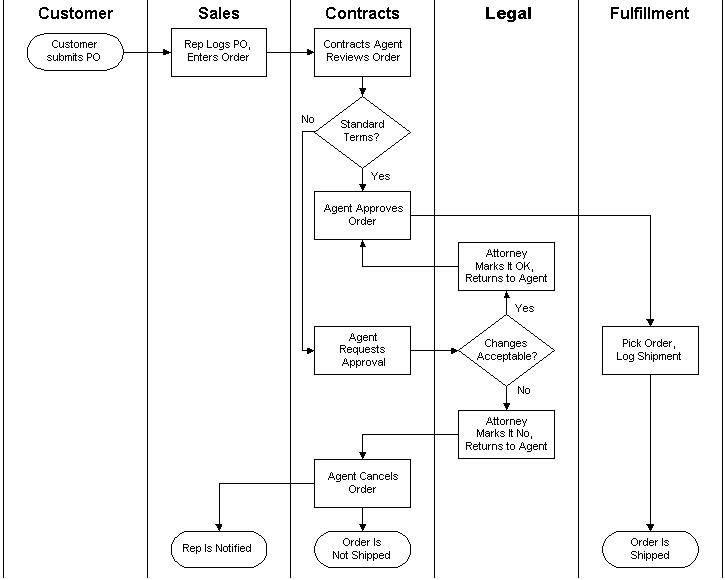
Swimlane diagrams, then, are visual overviews of a process. They’re most useful regarding multi-departmental processes, where various people from separate departments need to undergo certain tasks to complete the process at hand.
In the above example, you can see that the whole process has been laid out, and covers tasks carried out by the sales team all the way to the fulfillment team. By using a swimlane diagram to map out a process and show who does what when, it ensures that nobody steps on somebody else’s toes, and a process can run smoothly. (Providing that all team members know about and can access the swimlane diagram, of course.)
A quick history lesson on how the swimlane diagram originated
If you haven’t yet come across the swimlane diagram, you may be wondering why on Earth you haven’t heard of it before, who’s actually using swimlane diagrams, and, most importantly, how the swimlane diagram came into existence.
So, here’s a micro-history lesson for you.
The swimlane diagram was first seen in the 1940s. It was designed as an alternative to multi-column charts — a similar flow process chart — and was most likely concocted by an academic or a brainy business systems thinker. In the 90s, Geary Rummler and Alan Brache, two organizational performance and business system pros, wrote the insightful and game-changing book Improving Performance. The pair called swimlane diagrams “Swim Lane diagrams” instead, and brought the diagram back into general consciousness. Since then, countless organizations have internally used swimlane diagrams to better their organizations’ approach to processes, and especially when it comes to multi-departmental processes.
This is all to say that the swimlane diagram was conceived and developed by smart, knowledgeable people, and smart, knowledgeable people who have caught wind of the swimlane diagram have been making use of it, too.
How to create a swimlane diagram (& best practices)

Creating a swimlane diagram yourself is by no means hard. It’s incredibly simple, as long as you know what you’re doing (naturally!) and some prep-work has been done beforehand.
Are you ready to make your own?
If so, allow me to walk you through the step-by-step process of creating your very first swimlane diagram.
Step #1: Choose your swimlane diagram medium
First thing’s first: you’ll need to figure out what medium, exactly, you’ll be creating the swimlane diagram in. By this, I mean will you be using the humble pen and paper method? Or, will you be using a blackboard and a marker? Perhaps you’ll go down the digital route?
If you want your swimlane diagram to be digitized from the get-go, there are a myriad of tools to choose from. In fact, you can even use something like Microsoft Word that has all the in-built shapes and symbols you need.
I advocate — unless it just isn’t possible or feasible — everyone to use a digital tool or piece of software to create their swimlane diagrams. Not only does it mean there’s less chance of the completed diagram getting lost — after all, paper is notorious for going walkabout — but it also means that the diagram itself will be more accessible. It can go straight on the company intranet, Dropbox, or shared GDrive once it’s been made, allowing all employees to reference it.
Step #2: Decide what business process will be mapped
No matter if you’re a small startup or a large multinational, you’ll certainly have business processes that require input and actions from people in multiple departments.
With this in mind, what business process should you map via a swimlane diagram first?
It’s situational.
If it’s come to your organization’s attention that a particular process requires improvement — perhaps bottlenecks are occurring, or various people are all tackling the same task when only one should be — then do that first. On the flip side, if you believe all your multi-departmental business processes are being tackled appropriately, you may want to choose the processes that are more involved and laborious first, or the processes that fresh hires have involvement in (as having a documented swimlane diagram will be undeniably useful for folks getting to grips with processes that are new to them).
Step #3: Interview stakeholders
Let’s say it’s become your mission to create a swimlane diagram (or two, or three, or four…). If you don’t have any direct involvement in the process yourself, and if key stakeholders aren’t with you when creating the swimlane diagrams, you’ll want to interview those stakeholders to get a strong grasp on how the process functions.
Otherwise, how will you create an accurate, representative swimlane diagram?
Simply put, you can’t.
Talk to the stakeholders — the people who run, have involvement in, and have even thought up the process — and ask them questions so you know the ins and outs of the processes you’re about to map out.
Step #4: Create the diagram lanes
After interviewing the stakeholders, the prep-work is officially over. That means, from now onwards, it’s all about the swimlane diagram proper!
The basis of the swimlane diagram is the lanes. So, either by hand or via tech, create however many lanes are necessary. A hiring process, for instance, will need to have lanes for the HR/People team in charge of hiring, the department that’s looking for a new staff member, be it the manufacturing team or the marketing team, and the applicant themselves (as it’s their actions that move the process along, too).
The number of diagram lanes you need will always differ. It’s a case-by-case scenario.
Once there’s an appropriate number of lanes, make sure to write down the department name at the top.
Step #5: Map the process steps
At this point, with all the collected information and lanes, it’s time to map the process out by putting the relevant tasks in the corresponding lanes. Remember, you’ll need to use specific shapes and text.
At the beginning of this post, I mentioned that different companies use shapes in their swimlane diagrams in varying ways. While this is still the case, it’s common to use the following shapes to mean the following things:
- Rounded rectangle to represent the start and/or endpoint
- Rectangle to represent an action and/or activity
- Diamond to represent a decision
- Large circle to represent a terminal point
However, it is up to you which shapes you use, as long as you remain consistent. (I’m repeating myself, I know, but consistency is key!)
When the shapes have been added, clearly note what the task is with short, to-the-point text. For a hiring process, the beginning task could be a rounded rectangle in the lane for the department that’s hiring, with the text ‘hiring manager writes job description’.
To boot, ensure to use typical flowchart arrows to show what comes after (and/or before) each task.
Step #6: Get swimlane diagram feedback
After the entire process has been mapped out via the swimlane diagram, present it to the stakeholders you spoke to and get their feedback. This will help you make double sure that the diagram is accurate.
If a stakeholder does reply with a proposed change — for instance, changing the text of a task slightly, or adding in another task entirely — then make those amendments. Rinse and repeat until the swimlane diagram is nothing short of perfect, which, in this instance, means error-free!
Pat yourself on the back; you’ve successfully created your very first swimlane diagram, which you’ll now be able to reap the benefits of.
Speaking of which… What are the benefits of swimlane diagrams, precisely?
The pros of the swimlane diagram

As humans — and particularly as businesspeople — we don’t want to waste time and energy on activities that we don’t, in one way or another, benefit from. I’m sure you’ll be glad to hear, then, that swimlane diagrams aren’t a waste of time.
Here’s why:
- Swimlane diagrams provide high-level overviews of a process
The swimlane diagram is all about providing clarity. Thanks to its lanes for each department, and the shapes and text that show people what needs to be done when, teams have a clearer idea of how particular processes function. If knowledge is wealth, by creating swimlane diagrams for your integral processes that all employees can access and see, you’re reining in $$. And, quite literally, you’re able to save money by putting a stop to human error and mistakes by giving folks an overview of regularly undertaken processes!
- Because swimlane diagrams are visual, they relay information quickly
I can’t quite quote the phrase “a picture is worth a thousand words,” because it’s a diagram that has a small amount of text in it. But, because the swimlane diagram is visual and not just a purely text-based artifact, viewers will be able to get the gist of a process far more quickly than if they had to wade through, say, a Word document. Swimlane diagrams, then, impart info stat.
- Working on swimlane diagrams deepens understanding
When a process is mapped out via a swimlane diagram, the person (or people) working on it has their knowledge of the process deepened. Plus, the stakeholders who are interviewed and asked about the process have their understanding deepened as well. And it’s with this knowledge that you can then improve your processes (which leads us onto my next point rather nicely)… - Swimlane diagrams are useful for spotting Muda and tackling redundancies
Muda, as explained in a previous FAT FINGER post, is the Japanese term for ‘waste.’ In a business context, waste can take the form of bottlenecks, unnecessary steps, or activities that squander money, time, and effort. The beauty of working on a swimlane diagram is that you can get insight into whether the process you’re looking at is as good and as lean as it could be. You’re given the opportunity to spot redundancies, and then remedy them for the better.
Pretty nifty benefits, yes, but there’s more to the story…
The cons of swimlane diagrams versus BPM alternatives

In the spirit of being balanced and nuanced, it’s only appropriate that, on top of discussing the plusses, I talk about the negatives, too.
There are more positives than negatives, true, but when it comes to effective business process management in the modern-day, there are two negatives that especially let swimlane diagrams down.
Specifically, these are:
- Swimlanes are high-level, meaning not everything is explained in detail
Thanks to swimlane diagrams, teams can see who needs to do what and when. But this information is very general, and doesn’t quite go into deep enough depth. Who, exactly, from the 30-people marketing team should carry out the specific action noted under the marketing lane in a swimlane diagram? If the swimlane diagram concerns the hiring process, what if there are two hiring managers in any one department? And how, exactly, should specific tasks and actions be carried out? What are the subtasks of that task, and what should be avoided and not avoided? Swimlane diagrams convey info quickly, but to truly get into the nitty-gritty, you’re going to need more than a swimlane diagram.
- Because a swimlane diagram is indeed a diagram, it isn’t actionable
Once a swimlane diagram has been completed and uploaded to an accessible place for employees, it can be referenced time and time again. But it can’t be actioned in the way that a checklist can be actioned, where it actively prompts you to take steps to complete processes to a high quality, each and every time. A checklist can also provide people with a detailed step-by-step guide for a process, meaning even new hires can jump straight in and complete tricky processes like they’d been at the company for yonks.
At FAT FINGER, we realize the usefulness of swimlane diagrams. However, we also know that fast-paced, modern businesses, need something more substantial to go about their processes like a pro.
That’s why we made FAT FINGER.
Use FAT FINGER to complete multi-departmental processes without chaos & confusion
FAT FINGER enables teams to digitize their essential processes, procedures, and workflows with one simple tool.
You can easily document your processes, step-by-step, via our ‘apps’ — which are digital checklists. Team members can then work through those digital checklists when a process needs completing.
It doesn’t matter if staff members are working in an office or on-site, they’ll be able to quickly find the checklist they need, read through the steps, tick them off as progress is made, and get the job done to a stellar standard. Every time.
Here’s how FAT FINGER works in action.
In terms of business process management success, digital checklists can supply the what, why, when, and the how of business processes—something that, although useful in its own right, swimlane diagrams can’t deliver. That’s because checklists give people space to write as much info as necessary, and the opportunity to properly go into detail. And, among many other features that help to reduce process-related chaos and confusion — like notification features, authorization features, and real-time dashboard reporting — our task assignment feature ensures the right person always completes the right task in any given process!
With all this in mind, you can use FAT FINGER entirely in lieu of a swimlane diagram.
However, if you’ve been converted to both swimlane diagrams and FAT FINGER, think of swimlane diagrams as a great visual accompaniment to our nifty apps. (You could even include a swimlane diagram at the beginning of an app, to give employees a visual overview before they begin the process itself!)
That’s enough explaining. It’s time for you to try FAT FINGER yourself.
Sign up for a free trial here.
Just don’t forget to watch the video below where James McDonough, the CEO of FAT FINGER, goes over essential tips and tricks to maximize your FAT FINGER usage.
Here’s to completing essential business processes swimmingly.