

As the oil and gas industry continues to evolve, the need for efficient and effective data management has become more critical than ever. One tool that is revolutionizing the way this industry operates is FAT FINGER, a digital workflow procedure builder that empowers front-line teams to do their work correctly every time. This article will explore the benefits of integrated data visualization and analysis in the oil and gas sector, with a particular focus on how FAT FINGER is making a difference.
Understanding the Importance of Data in Oil and Gas
Data is the lifeblood of the oil and gas industry. It informs decision-making, drives operational efficiency, and underpins strategic planning. However, managing and making sense of this data can be a complex task. This is where integrated data visualization and analysis come into play.
What is Integrated Data Visualization and Analysis?

Integrated data visualization and analysis is a process that combines data from various sources into a single, easy-to-understand format. It allows users to see patterns, trends, and insights that would otherwise be difficult to discern. This is particularly useful in the oil and gas industry, where data is often scattered across different systems and formats.
Benefits of Integrated Data Visualization and Analysis in Oil and Gas
- Improved Decision Making: By visualizing data, decision-makers can quickly identify trends and patterns, leading to more informed decisions.
- Increased Operational Efficiency: Integrated data analysis can help identify bottlenecks and inefficiencies, leading to improved operational performance.
- Enhanced Safety: By analyzing data from safety checklists and incident reports, companies can proactively address potential safety issues.
- Cost Savings: By identifying inefficiencies and improving operations, companies can significantly reduce costs.
Case Study: FAT FINGER in Action
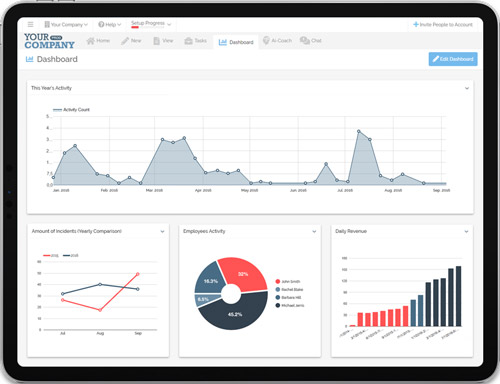
FAT FINGER is a prime example of how integrated data visualization and analysis can transform operations in the oil and gas industry. With features like a drag & drop workflow builder, mobile & desktop workflows, dashboards, integrations, augmented reality, and artificial intelligence coaching, FAT FINGER allows companies to streamline their operations and make data-driven decisions.
For instance, FAT FINGER’s digital workflows and checklists can be used across various safety, maintenance, and operations areas, such as near miss reporting, risk assessment, incident reporting, quality control, shift handover, work order checklist, and predictive maintenance. By integrating and visualizing this data, companies can gain valuable insights, improve safety, and increase operational efficiency.
Conclusion
Integrated data visualization and analysis is a powerful tool for the oil and gas industry. It allows companies to make sense of complex data, leading to improved decision-making, increased operational efficiency, enhanced safety, and significant cost savings. Tools like FAT FINGER are leading the way in this field, providing a comprehensive solution for data management and visualization.
Whether you’re looking to streamline your operations, improve safety, or make more informed decisions, FAT FINGER can help. Sign up today or request a demo to see how FAT FINGER can transform your operations.
Discover the benefits of Integrated Data Visualization and Analysis in the oil and gas industry. Enhance your decision-making process, improve operational efficiency, and reduce costs. Don’t miss out on this opportunity to transform your business. Visit FatFinger now to learn more.